Please select a default template!

A question clients often have for advisors is, “when is the best time to invest?” Specifically, clients often wonder what is the best way to have their dollars outside of their emergency fund “work” for them in the most efficient matter. As an important aside, investing into equities should be done with a long-term time horizon, specifically earmarked for mid and long-term goals.
Sitting on cash (using 3-month treasuries dating back to the great depression) would have earned on average just over 3%.
Investing in equities (using the S&P 500 dating back to the great depression) would have earned on average just over 9% assuming you reinvested dividends and interest.
However, a sound financial plan should look at many factors on top of just investment returns: When is the capital needed? What is the time frame for the money? What is the risk tolerance of the individual? How is the money supporting life by design of the individual?
Assuming that all factors have been evaluated, and that the goal is to move cash (that is not needed for the short term) into equities (invested for the long term), then it is very important to get past the media’s negativity, and emotions that trip up a lot of investors from making the move.
“This time is different”. “What about the debt that US owes?” “The stock market valuations are too high.” “We are entering a recession”. “I am going to wait until the S&P 500 comes down”.
The list goes on and on…
Historically the S&P 500 goes up about 75% of the time and goes down 25% of the time. Trying to time this once (let alone twice) is nearly impossible. In fact, if the S&P 500 has a good year or bad year, it still historically averages about a 14% drop regardless (of good or bad). Volatility is a good thing for long term investors as it transfers wealth from the impatient investor to the patient investor.
The probability of cash outperforming the S&P 500 is between 16-31% when looking at 1 year – 7 year rolling averages.
However, the probability of cash outperforming the SP 500 drops to 1% when looking at 20 year rolling averages.
So the first major takeaway is that the more time you have to keep your money invested in equities, the more irrelevant timing cash into the market becomes.
Usually, we see 3 options for investing cash:
At EWA, we do not recommend #1, but instead have developed a hybrid strategy between #2 and #3.
Let’s first look at a high-level overview of dollar cost averaging.
Dollar cost averaging is, quite simply, a practice of investing a fixed dollar amount on a fixed, recurring schedule. This fixed savings occurs regardless of share price or overall market outlook. The idea behind dollar cost averaging is to encourage a disciplined investment strategy, avoid attempting to “time” the market, and seek to capture a lower average cost per share compared to a lump sum strategy.
For example, let’s assume Mr. Smith invests $10,000 per month for five consecutive months. If the market is up and share prices increase, the $10,000 will buy fewer shares. In a similar fashion, if the market is suppressed and share prices drop, the $10,000 will buy more shares. Over time, dollar cost averaging could aim to seek a lower average cost per share than if $50,000 was simply lump summed in the first month.
Let’s assess the following example, assuming the above scenario of $10,000/month invested over five months. In each month, Mr. Smith invests at a different share price. Months 1 and 2 have a share price of $5, Month 3 drops significantly to $1, Month 4 increases up to $3, and Month 5 gets back to its original $5 share price.
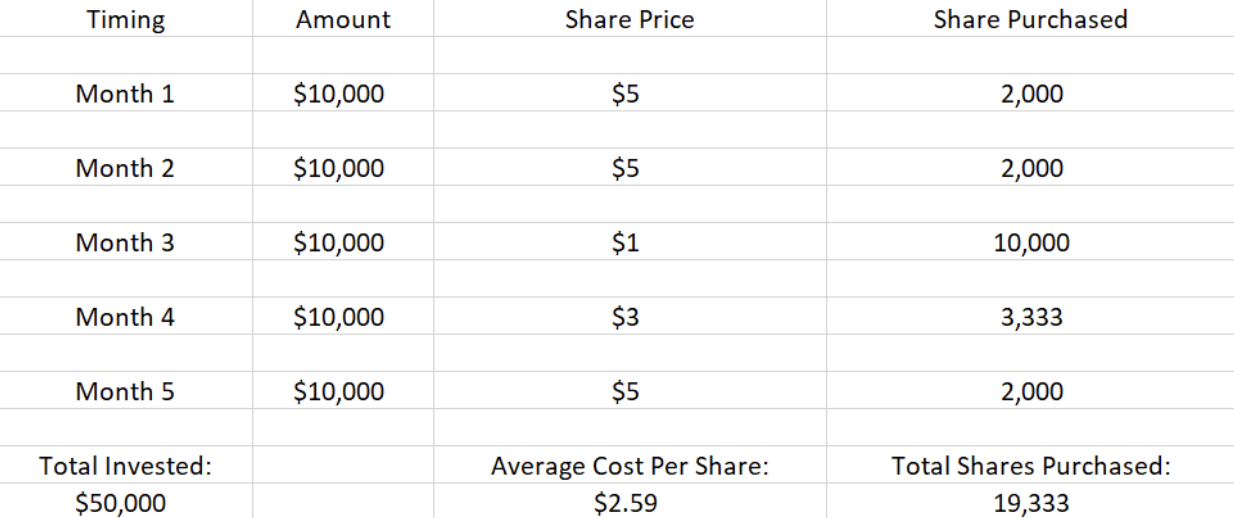
In this example, Mr. Smith was able to take advantage of the lower share prices in Months 3 and 4. This allowed the client to “buy in” the market at a lower point, and, as a result, lowered his overall cost per share. Ultimately, Mr. Smith resulted in owning $19,333 shares from his original $50,000 deposited into the market over five months.
In contrast, let’s assume Mr. Smith rather invests $50,000 as a lump sum in the first month and makes no further investments. In this example, Mr. Smith gets his entire investment into the market at $5/share. The downside here is that Mr. Smith has no more buying opportunities during Months 3 and 4, when the share price falls.
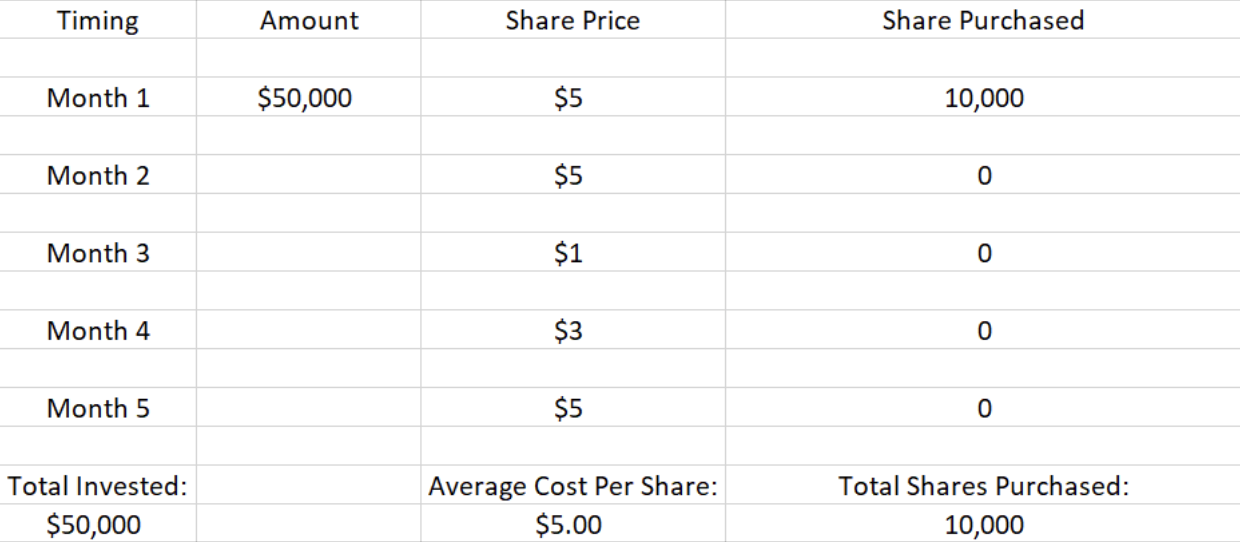
This results in Mr. Smith owning 10,000 shares at $5/share from this lump sum example, as opposed to 19,333 shares at $2,59/share by dollar cost averaging in a disciplined fashion. With hindsight in mind, Mr. Smith would have been better off waiting to invest all $50,000 in Month 3, when the share price dropped all the way down to $1. However, trying to time the market and dictate when the prices will rise or fall is historically a losing game for most. A strategic way to participate if the market falls is to be a consistent investor– employing a strategy like dollar cost averaging.
Is dollar cost averaging always the best mathematical strategy? Not necessarily. The best strategy, based on historical data, has shown that lump sum investments have actually outperformed dollar cost averaging strategies. Generally speaking, markets tend to rise more than they fall, so simply getting the money invested as early as possible, for mid and long-term goals, has shown to be a wise financial decision.
Establishing sound investment habits through disciplined, automatic contributions will allow you to better stick to your overall financial plan. Additionally, from a behavioral standpoint, a lump sum investment could be harder to stomach if the market takes a downward turn. Behavioral experts often claim that humans by nature are “loss-averse,” meaning losses feel worse than wins feel good. If a dollar cost averaging strategy is employed, one will be investing smaller amounts of money over time, allowing a potentially smoother ride and allow for emotions to take a back seat.
For these reasons, we have employed a hybrid strategy for EWA clients that have cash to invest:
We have found this strategy of balancing historical probability and statistics, while honoring the emotions and uncertainty of the stock market, to generally equal investor peace of mind.